
Ettore Recchi, Emanuel Deutschmann and Maxime Chabriel hanno recentemente creato un dataset per stimare la mobilità internazionale sulla base di statistiche globali sul turismo e sul traffico passeggeri. Tra il 2011 e il 2016 sono stati conteggiati oltre 15 miliardi di viaggi e la tendenza è in aumento. Questi risultati preliminari, insieme ad alcune delle più importanti implicazioni, sono presentati e analizzati in questo articolo.
Estimating transnational mobility on a global scale
A best-seller in the social sciences calls ours ‘the age of migration’ (Castles et al 2013). Perhaps, in fact, we should call it ‘the age of mobility’. The size and scope of movements of people across national borders – with a plethora of goals other than migrating – has never been so high in human history. Tourism is one of the largest industries on earth, employing about 10 per cent of the global workforce and producing 10.4 per cent of the world GDP (World Travel and Tourism Council 2019). However, the demographic size and directions of transnational mobility flows have never been measured systematically. This lacuna has been recently filled by the Global Transnational Mobility Dataset (GTMD) created at the Migration Policy Centre (MPC) of the European University Institute in collaboration with the Knowledge Centre on Migration and Demography at the European Commission Joint Research Centre (Recchi, Deutschmann and Vespe 2019).
This dataset draws on two complementary sources: the national files on tourism¹ of the UN World Tourism Organization and a dataset on global flight passengers provided by Sabre, an air travel industry company. Designed and developed for different purposes, each of these sources has shortcomings. For instance, the UNWTO data do not include people crossing borders for reasons other than tourism (such as returning residents, migrants and asylum-seekers) and the data on air passenger traffic include only people who travel by airplane. The GTMD remedies these biases by combining the two data sources and leveraging on their relative strengths, thus producing more reliable estimates of cross-country human mobility.
How many, where, when?
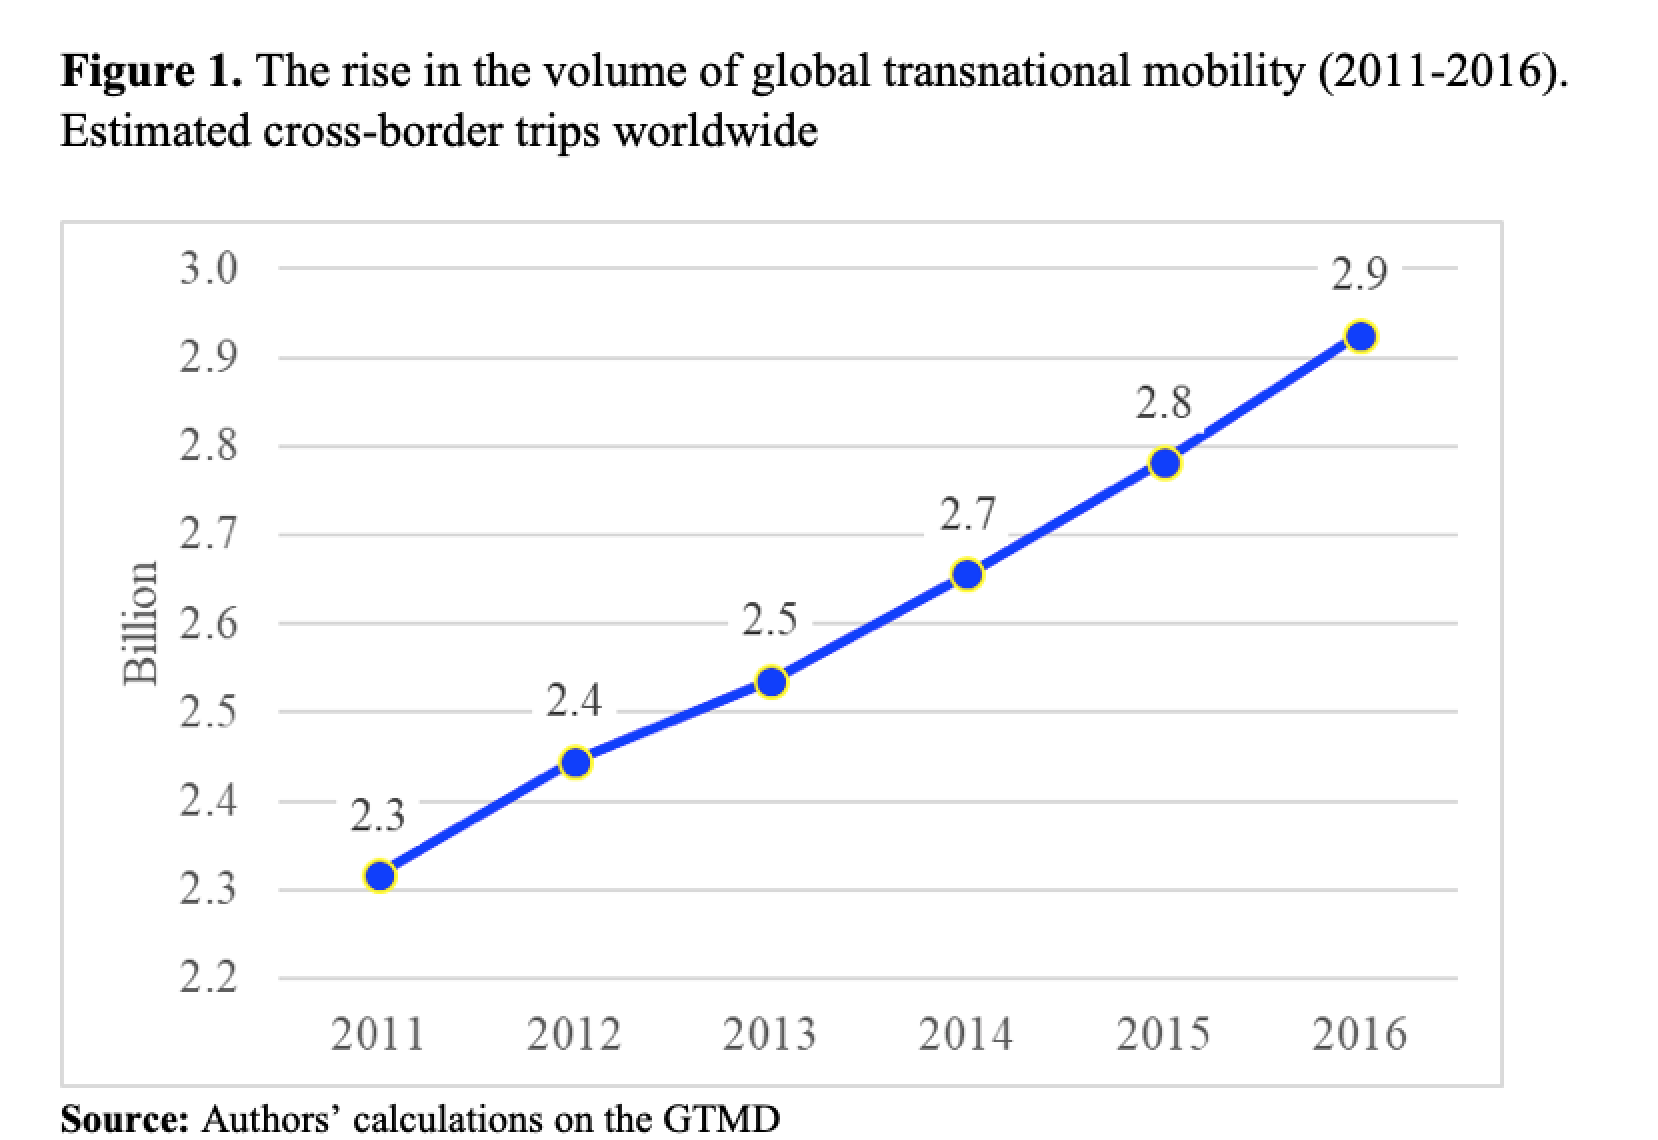
The GTMD answers a key question: how many border-crossings take place worldwide yearly? In 2016, there were 2.9 billion estimated trips (Figure 1). This figure has increased progressively from 2011, when it was 2.3 billion. A 25 percent increase in six years is quite spectacular, if we use population growth in the same period (5 per cent) as a benchmark. Humankind is expanding, but human mobility across countries is expanding at a much faster pace. At the same time, a rise in the volume of overall travel does not necessarily mean a proportional increase in the number of individuals on the move. We can, in fact, suspect that a large part of the increase is due to more travel among the economically better-off. Richer people can afford more frequent and more long-distance journeys.
A second takeaway is the geographical skewness of mobility, which clusters around certain borders. The largest mobility flows on the planet occur between China and Hong Kong, and China and Macao in Asia; between Germany and Poland, and between the UK and Spain in Europe; and at the USA-Mexico border in America. Conservatively, the mobility flows between these countries exceed 30 million trips per year. The huge size of some flows, though, must not obscure another message of the data. Among the entire collection of 229,320 combinations of country of origin and country of destination over six years (i.e., 38,220 per year, for 196 countries), more than half (more precisely, 52.8 per cent) amount to less than one hundred journeys per year. The overall structure of global mobility is thus extremely unbalanced. Another way of looking at this skewness is to move up the scale of analysis, from countries to world regions. The lion’s share of international mobility revolves around Europe, where 46.9 per cent of world cross-border travel originates. Asia comes second (34.3 per cent), and the Americas a distant third (13.7 per cent). Overall, journeys departing from an African or an Oceanian nation are a modest share of the total (3.9 and 1.2 per cent, respectively). Worldwide, an overwhelming share of international movements takes place on a regional scale: globally, 80 percent of cross-border travel occurs within, not across continents.
Community detection algorithms allow us to visualize the network structure of global mobility flows. This technique detects clusters of countries that are densely connected with each other through travel. In this case, we apply it to the entire global network of transnational mobility in 2016, provided each country pair is connected by at least 5,000 trips (Figure 2).

The different clusters are highlighted with distinct colors. The automatic community detection reconfirms that human mobility is regionally concentrated. Clusters overwhelmingly align with continents on the world map. The orange area emphasizes the tight connections within Europe, with some outposts in Central Asia (including Russia). The violet lines reflect the American cluster, which spans across the northern and southern part of the continent. The blue lines signal the relatively stronger-than-average links between the Americas and East Asian countries. Lastly, the green lines emphasize the proximity through travel of Africa (especially South Africa) with Asia and Oceania.
What is behind differences in transnational mobility? A preliminary macro view
What boosts transnational mobility? By combining the GTMD with other existing global datasets, we shed light on some geographic, sociodemographic, economic, and political conditions that can plausibly favor country-to-country travel. Table 1 reports the correlation between the size of between-country flows and a number of sending and receiving countries’ characteristics.
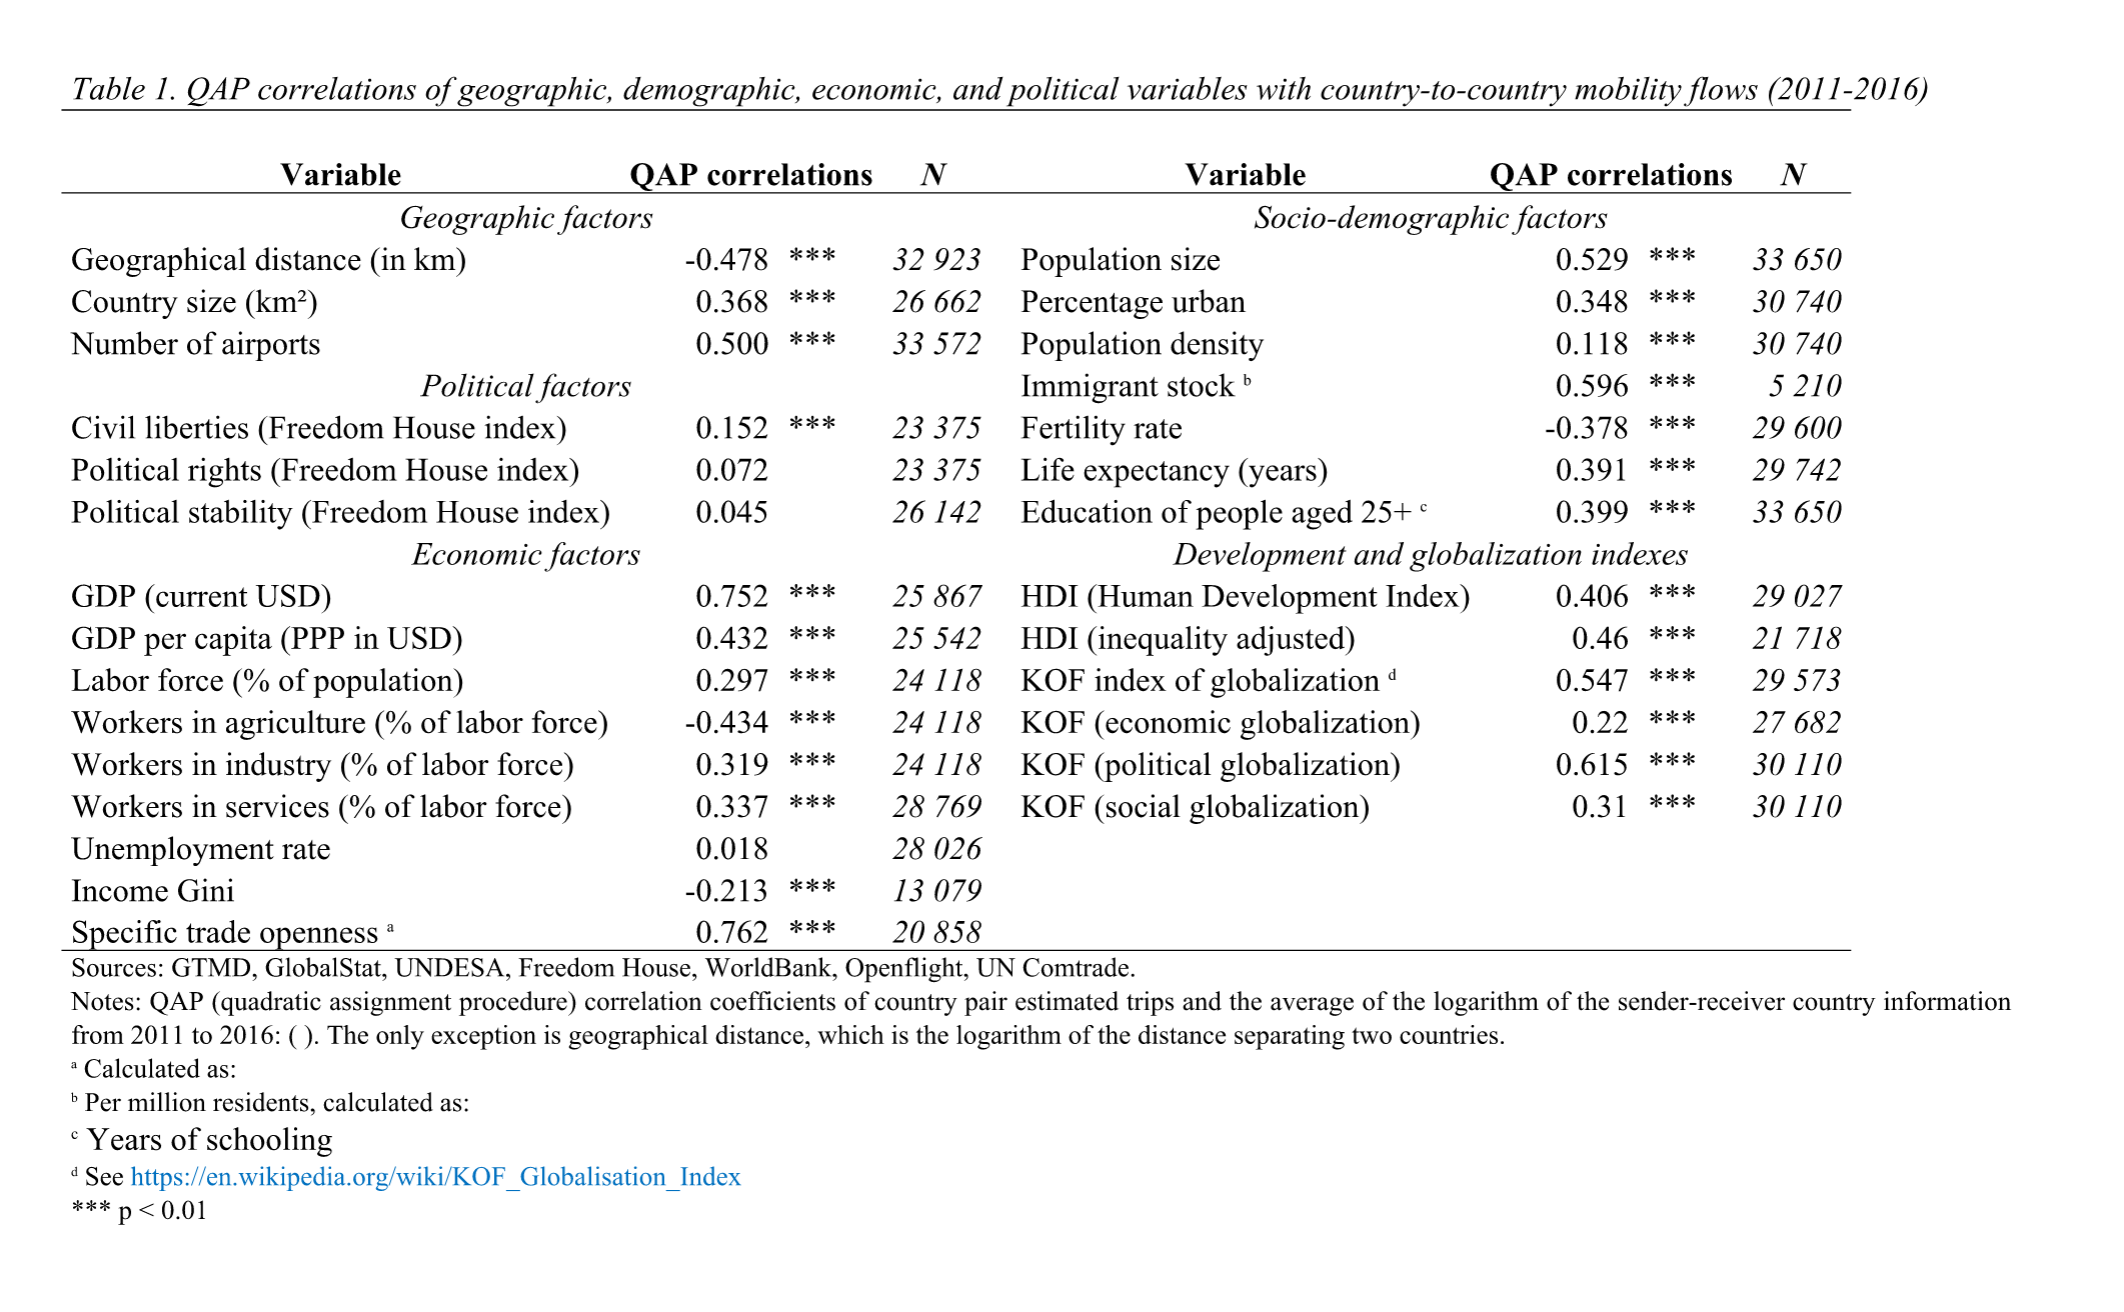
Some correlations are in tune with gravity models of spatial interaction, whereby mobility is directly proportional to the population size of the sending and receiving countries and inversely proportional to their distance apart. Not surprisingly, we find that more developed and richer countries (using different indicators) attract higher mobility flows. Either directly or indirectly, mobility is also correlated to basic demographic factors, like fertility and life expectancy. Our expectations that the volume of mobility flows is correlated with migration stocks, levels of income equality and international trade are also corroborated. Political factors, (as measured by Freedom House indexes) on the other hand, are only poorly associated to the volume of mobility.
Of course, more fine-tuned modeling is needed to test which exogenous factors are more likely to affect global mobility and which are, in fact, spurious predictors. This brief article is meant to be a first illustration of the dataset and its potential for further research. Interested readers can explore the data on the KCMD’s Dynamic Data Hub, a free tool that allows users to delve into the travel relations between countries globally on an interactive world map. Access to the data themselves can also be requested: GMPdataset@eui.eu.
*”Articolo presente anche sul sito www.niussp.org“
References
Deutschmann, E. (2016). The spatial structure of transnational human activity. Social science research, 59, 120-136.
Recchi, E. (2015). Mobile Europe: The theory and practice of free movement in the EU. Basingstoke: Palgrave.
Recchi, E., Deutschmann, E., & Vespe, M. (2019). Estimating Transnational Human Mobility on a Global Scale. Robert Schuman Centre for Advanced Studies Research Paper No. RSCAS, 30.
World Travel & Tourism Council (2019). Economic Impact.
Footnote
¹ Tourism, according to the UNWTO, is not limited to cross-border movements for leisure, as in the common usage of the term. It includes any movement from country A to country B without a purpose of settlement (business travel, visits to relatives and friends, etc.).
Source figure 1 and 2
www.migrationpolicycentre.eu