
The European Union has recently paid great attention to cohesion policy, with the aim of achieving a smart and inclusive growth in all the regions of Europe, and to overcome the effects of the ongoing financial crisis, in Italy and elsewhere.
In June 2010, the European Council adopted the “Europe 2020 Strategy”, put forward by the European Commission, which defined three priorities for growth in the European countries: Smart growth (developing an economy based on knowledge and innovation), Inclusive growth (fostering high employment, and ensuring social and territorial cohesion) and Sustainable growth (promoting a more resources-efficient, greener and more competitive economy).
To reach these objectives, a number of benchmarks have been set, and the relevant variables are subject to regular statistical monitoring and reporting.
National targets were identified, but national figures alone do not reveal the full picture of what happens in the European Union: regional differences are wide in several European countries, and they need to be taken into account to fully understand economic, social and environmental phenomena.
The Europe 2020 headline indicators on inclusion and smartness
Let us focus on the issues that are generally considered to be the most important: Inclusion and Smartness. Inclusive growth is measured by the employment rate and the rate of people at risk of poverty or social exclusion. Smart growth is measured by the proportion of early leavers from education and training, the share of persons (25-34 years old) with tertiary educational and the percentage of gross domestic expenditure on research and development (R&D) on GDP (European Union, 2014).
Smart Growth
Early school drop-out is linked to unemployment, social exclusion, and poverty. Among the 273 Regions analysed, Calabria and Sicily occupy the 12th and 14th place in the ranking on the early school leavers rate (a quarter of young people do not complete their first stage education cycle).
Among the 20 regions with the lowest shares of young adults (30-34 years) with a university degree, six are in the Mezzogiorno of Italy, with values below 20%. Among the best twenty, eight regions are from UK.
The highest levels of regional spending on R&D are found in Belgium, Germany, UK, Denmark, Sweden and Finland (4% or more). Italy ranks low, with values that range from 0.5% (Molise and Calabria) to 1.9% (Piemonte).
Inclusive Growth
The highest regional employment rates in the EU28 (with 80% and more – and exceeding the EU-wide target of 75%) were recorded in the Regions of Northern Europe and in Germany, the Netherlands and the UK. Sweden performs well in general, and has exceedingly high values (“well above 80%”) in the Stockholm, Småland and Western Sweden regions.
The lowest regional employment rates in 2012 were generally found in the southern parts of Spain and Italy, as well as in various regions spread across Greece, Croatia, Hungary and the French overseas domains and territories.
There were four regions in southern Italy where less than half of the population aged 20–64 was in employment, namely Puglia, Calabria, Sicilia and Campania. The latter has the lowest employment rate in Europe, just above 40%.
The top ten regions with respect to the percentage of the population at risk of poverty and social exclusion are located in Romania, the Czech Republic, Finland, Slovakia and Italy. They tend to be urban areas with high average per capita GDP. The recent years have seen significant movements in this indicator which is also characterized by the largest relative spread in values. Poverty and social exclusion is highest, above 32%, in Sicily (IT), Campania (IT) and Calabria (IT) together with Canary Islands (Spain) and North-East Romania.
An indicator of regional socio economic conditions
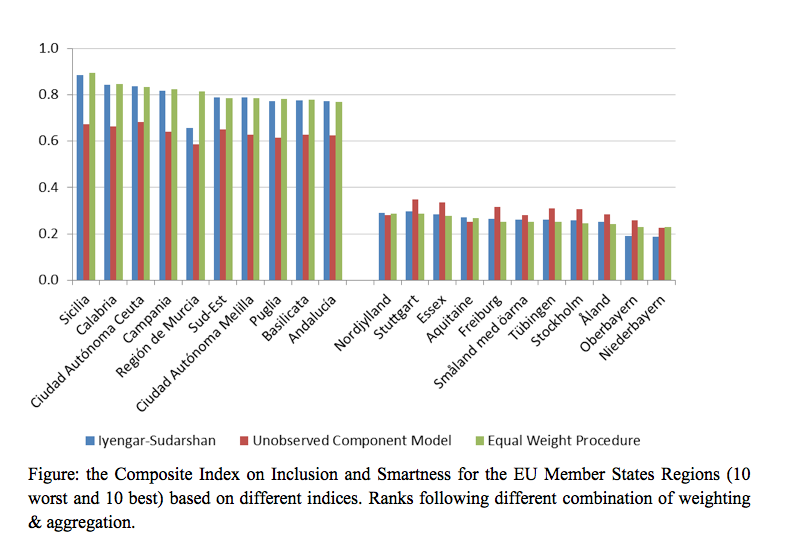
In order to measure the distance from the targets of Europe2020 on inclusion and smartness, a composite indicator has been constructed. Composite indicators are increasingly recognised as a useful tool in policy analysis. Such composite indicators provide simple comparisons among regions, that can be used to highlight differences with regard to complex issues such as economy, society or growth. After applying the usual Imputation of missing data techniques, and verifying their non systematicity, we conduct a Normalisation, (using a “Min-Max” method) and then we calculate three different Composite Indicators (Grimaccia, Lima 2015), applying the Iyengar-Sudarshan Method, the Unobserved Component Model and an Equal Weight Procedure as weighting techniques, while the Linear Method has been used as aggregation rule (OECD 2008).
Using a Spearman’s rank correlation coefficient we verified that using different weighting methods hardly affects the ranking of the regions.
In our “Distance to Inclusion and Smartness” Indicator, five out of ten regions are in the Mezzogiorno of Italy. No Italian Region appears among the best ten: indeed, the best performance, that of the Province of Bolzano, is 100 positions behind the top European ranking. In short, Italy in not performing particularly well; neither on average nor in any of its territories.
Conclusions and policy remarks
 The crisis has had a major impact on regions across the EU: regional social and economic disparities have stopped narrowing, poverty and exclusion have increased, including in many cities in the richer Member States. In particular, the distance on Inclusiveness and Smartness of regions of the Mezzogiorno of Italy from the Europe 2020 targets is among the highest in Europe, independently of how it is measured.
The challenges faced by Member States is increasingly spread beyond national boundaries and cooperation is needed to tackle them effectively. Therefore, the attention of the EU in regional issues is increasing and the EU’s cohesion policy – closely integrated with the Europe 2020 strategy – will, over the next six years, be the EU’s principle investment tool for delivering the Europe 2020 targets (Eurostat 2014). Indeed, one of the two main goals of the EU Cohesion Policy, the European Territorial Cooperation, is providing a framework for joint action and policy exchanges between national, regional and local actors in different Member States.
*”Articolo presente anche sul sito www.niussp.org“
References
- European Union (2014), An Indicator for Measuring Regional Progress towards the Europe 2020 Targets
- Eurostat (2014) Regional yearbook
- Grimaccia E., Lima R. “Quality of Life in Europe and Italy: Regional disparities according to the Europe2020 indicators on inclusion and smartness” presented at the Giornate di studio sulla popolazione 2015, University of Palermo, 4-6 February 2015
- OECD (2008) Handbook on constructing composite indicators: methodology and user guide